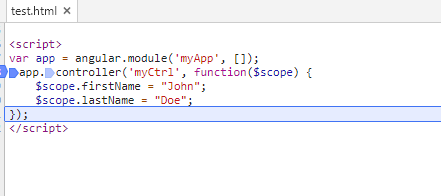
Since AngularJS is a JavaScript framework so applications developed in AngularJS executes on the browser.To troubleshoot any problem you need to step through or debug the code on the browser.You can easily debug the application using developer tools which is provided in most of the modern browsers.You use F12 shortcut to open the developer tools.
Follow the below 3 steps to debug your AngularJS code
1.Open the web page you want to debug in chrome
2.Press F12 to open developer tools.Select the sources tab from the list of tabs.You will be able to see the list of files which are available on the browser.
In the list of files on the right select the file which you want to debug.
3.Put the breakpoint in the right side code window.Press F5.Now the breakpoint will be hit and you can debug the application by pressing F10.You will be able to see the value of the variables as you debug.


Leave a Reply